Causal correlation or casual correlation
The following story is included in its entirety. Leaving aside all the effort which went into collecting the data, what does it say?
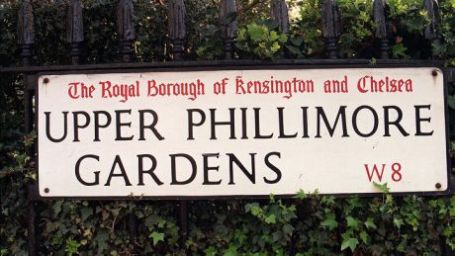
It doesn't say that if you asked the local council to rename your street, then your house price would automatically change. All that it is saying is that there is an interesting relationship between street names and house prices. The examples given of Upper Phillimore Gardens and Zeus Lane illustrate this; exchanging the names would have little effect on the prices - because they depend on the location, size, facilities, etc of the properties on each road.
Added to which, I have commented elsewhere on the methods used by estate agents to establish the current value of houses. Look at the precision of the figures here "the average home is worth £5,740,496." There are 53 properties in that road, and the algorithm for estimating their value gives a figure correct to the last pound. Now the properties vary from detached through semi-detached to flats. So the average is the average of dissimilar properties. (Adding grapes to oranges and melons to give the average for fruit.) Presumably their average is the mean. But is that an appropriate statistic to use, for data which are skewed, and by definition non-negative?
The house that I grew up in was in a road whose name began with R (£223,241). Most of my postgraduate years I lived in a road starting with S (£228,237) In Exeter, streets for my three homes have started with F, W and M (£228,489, £231,145, £221,498 respectively)
However, in the same order, those five streets have the following current average property prices:
£403,716 (A village with large houses)
£197,501
£190,002 (Exeter when I was single, where the properties included flats)
£217,555 (Getting married moved me up in status?)
£595,308
So what? As this blog is about Operational Research, I suppose that the story reminds me that one must ask whether we always ask the right critical questions about our analysis.
 Forget streets with the X-factor, living on a street with a name
beginning with the letter ‘U’ could mean your property is worth a lot
more, according to Zoopla.co.uk research.
Forget streets with the X-factor, living on a street with a name
beginning with the letter ‘U’ could mean your property is worth a lot
more, according to Zoopla.co.uk research.
We analysed average house prices on more than three-quarters of a million streets in the UK. The most expensive street beginning with ‘U’ is Upper Phillimore Gardens where the average home is worth £5,740,496.
Average property prices on streets that start with a ‘U’ currently stand at £251,307 – the highest of any letter in the alphabet – and £25,503 more than the current average UK property value of £225,804.
At the other end of the scale, streets beginning with the letter ‘Z’ have the lowest property values, with the average property worth just £180,046 – 20% less than the UK average. One particular example is Zeus Lane in Waterlooville, Hampshire. Despite being named after a Greek god, property values on the street are far from Olympian. The average property value on the street is just £141,278, 37% lower than the national average of £225,804.
Streets beginning with the letters T (£248,008) and O (£244,450) came in second and third respectively in terms of the highest average property values, while those starting with the letters J (£190,802) and A (£211,744) record the second and third lowest property prices.
And vowels beat consonants hands down when it comes to house prices. The average property on a street beginning with a vowel is worth £6,306 (3%) more than a street beginning with a consonant. Street names beginning with a consonant have an average property value of £222,789, compared to £229,095 for those with a vowel.
So, it seems that there may be more to a street name than meets the eye. With a £70,000 difference between the average property price on streets starting with the letters U and Z, and a £6,000 difference on average on streets beginning with vowels and consonants, it is advisable to select your street wisely!
As always, please feel free to share and use this info, all we ask is that you credit the source as Zoopla.co.uk and link to Zoopla.co.uk. Thank you.
It doesn't say that if you asked the local council to rename your street, then your house price would automatically change. All that it is saying is that there is an interesting relationship between street names and house prices. The examples given of Upper Phillimore Gardens and Zeus Lane illustrate this; exchanging the names would have little effect on the prices - because they depend on the location, size, facilities, etc of the properties on each road.
Added to which, I have commented elsewhere on the methods used by estate agents to establish the current value of houses. Look at the precision of the figures here "the average home is worth £5,740,496." There are 53 properties in that road, and the algorithm for estimating their value gives a figure correct to the last pound. Now the properties vary from detached through semi-detached to flats. So the average is the average of dissimilar properties. (Adding grapes to oranges and melons to give the average for fruit.) Presumably their average is the mean. But is that an appropriate statistic to use, for data which are skewed, and by definition non-negative?
The house that I grew up in was in a road whose name began with R (£223,241). Most of my postgraduate years I lived in a road starting with S (£228,237) In Exeter, streets for my three homes have started with F, W and M (£228,489, £231,145, £221,498 respectively)
However, in the same order, those five streets have the following current average property prices:
£403,716 (A village with large houses)
£197,501
£190,002 (Exeter when I was single, where the properties included flats)
£217,555 (Getting married moved me up in status?)
£595,308
So what? As this blog is about Operational Research, I suppose that the story reminds me that one must ask whether we always ask the right critical questions about our analysis.
Vowel play – street names starting with U have highest av. property values #zooplafacts
We analysed average house prices on more than three-quarters of a million streets in the UK. The most expensive street beginning with ‘U’ is Upper Phillimore Gardens where the average home is worth £5,740,496.
Average property prices on streets that start with a ‘U’ currently stand at £251,307 – the highest of any letter in the alphabet – and £25,503 more than the current average UK property value of £225,804.
At the other end of the scale, streets beginning with the letter ‘Z’ have the lowest property values, with the average property worth just £180,046 – 20% less than the UK average. One particular example is Zeus Lane in Waterlooville, Hampshire. Despite being named after a Greek god, property values on the street are far from Olympian. The average property value on the street is just £141,278, 37% lower than the national average of £225,804.
Streets beginning with the letters T (£248,008) and O (£244,450) came in second and third respectively in terms of the highest average property values, while those starting with the letters J (£190,802) and A (£211,744) record the second and third lowest property prices.
And vowels beat consonants hands down when it comes to house prices. The average property on a street beginning with a vowel is worth £6,306 (3%) more than a street beginning with a consonant. Street names beginning with a consonant have an average property value of £222,789, compared to £229,095 for those with a vowel.
So, it seems that there may be more to a street name than meets the eye. With a £70,000 difference between the average property price on streets starting with the letters U and Z, and a £6,000 difference on average on streets beginning with vowels and consonants, it is advisable to select your street wisely!
The A-Z (or U-Z!) of property values
| Starting Letter | No. of UK Streets | Avg. Property Value |
|---|---|---|
| U | 3,565 | £251,307 |
| T | 44,927 | £248,008 |
| O | 16,358 | £244,450 |
| H | 53,223 | £234,045 |
| C | 77,769 | £233,873 |
| P | 36,065 | £233,550 |
| W | 50,979 | £231,145 |
| F | 25,835 | £228,489 |
| L | 39,563 | £228,400 |
| S | 71,304 | £228,237 |
| B | 71,884 | £227,105 |
| Q | 3,826 | £226,824 |
| N | 18,475 | £225,911 |
| R | 31,154 | £223,241 |
| M | 51,216 | £221,498 |
| K | 16,728 | £221,106 |
| G | 33,335 | £219,248 |
| I | 4,316 | £219,125 |
| E | 19,216 | £218,849 |
| D | 25,395 | £218,643 |
| Y | 2,751 | £218,367 |
| V | 7,752 | £217,240 |
| A | 31,333 | £211,744 |
| J | 5,565 | £190,802 |
| Z | 180 | £180,046 |

Comments
Post a Comment