Seventy-one point four percent of statistics are made up
There are many times when I am amused or amazed by the use of statistics (and mathematics) in newspapers and magazines, sometimes because the writer has not understood what he or she is writing about, or because a sub-editor has allowed a numerical error or anomaly through to print, or because some number is just plain silly.
The claim in the title of this piece is one such.
My latest toe-curling experience has come from the magazine of a very large supermarket chain in the UK. In the pages devoted to preparing for Christmas, there are the following statistics, with my comments in []:
The second and third statistic are probably derived in the same way; their analysis and derivation are left to the reader to consider. And I have reinterpreted the fourth one for you.
Just remember - you will eat this number of mince pies:
The claim in the title of this piece is one such.
My latest toe-curling experience has come from the magazine of a very large supermarket chain in the UK. In the pages devoted to preparing for Christmas, there are the following statistics, with my comments in []:
- 8:39am - the time when the average family takes its first bite of chocolate on Christmas Day. [Not 8:38 or 8:40, please note]
- 38 - the number of days women spend on average preparing for Christmas [how do you decide if a day is spent preparing for Christmas or dealing with daily living?]
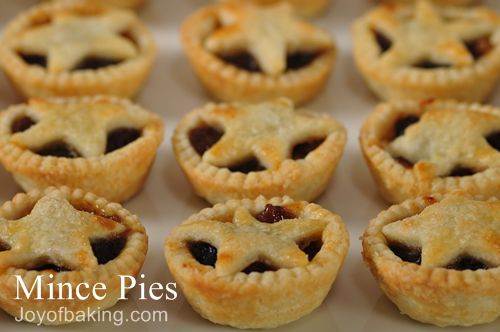
- 27 - the number of mince pies we each consume over the festive season [not the average, but "the number"]
- 83 - square kilometres of wrapping paper will end up in UK bins this Christmas, enough to cover an area larger than Guernsey [It sounds an impressive figure, but that amounts to just over one square metre of wrapping paper per person in the UK. That's about three sheets; how many sheets do you need for each large present?]
The second and third statistic are probably derived in the same way; their analysis and derivation are left to the reader to consider. And I have reinterpreted the fourth one for you.
Just remember - you will eat this number of mince pies:

Comments
Post a Comment